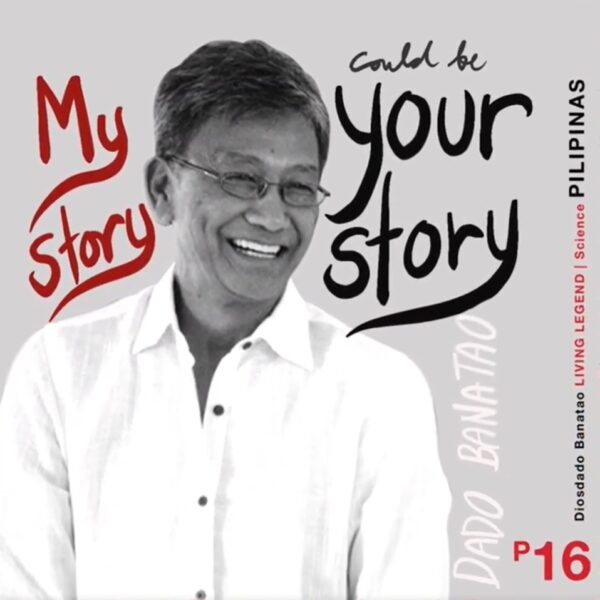
Stamp that Philippines issued to commemorate Dado Banatao
I was saddened to read that Filipino American Silicon Valley Pioneer Dado Banatao dies at 79. As you can see from his story shown in the video above, his life was a true rags-to-riches story. Not only was he a remarkable technologist but also a generous philanthropist. I met him and his wife Maria early in my career. Looking back, he had an ongoing influence in my life that I never realized.
Defying Stereotypes
When I met him at a meeting of Filipino American Society of Architects and Engineers (there was once an active Northern California branch) in the 1980’s, I was impressed how accomplished he was a founder and technologist, particularly as a Filipino American. Back then, a lot of chip manufacturing and assembly happened in the Silicon Valley. Most of the Filipino Americans in tech then were assemblers. A curious racial hierarchy ruled the valley – you would see many Filipino assemblers and technicians, Chinese and Indian Engineers, and white management. Even much later, not many Filipino American have become tech entrepreneurs. Yet during that time, he managed to break those stereotypical roles in a stunningly successful way. Above all, he and his wife seemed pretty humble and just regular folks.
Silicon Valley Impact
Much of modern technology is influenced by Banatao’s work. He was a member of the Homebrew Computer Club and met Steve Jobs and Steve Wozniak there. When I talked to him, he was proud of his work on the Commodore Pet, one of the early personal computers. At one point, the Commodore Pet outsold Apple computers! His company Chips and Technologies created chip sets that made it easy for companies to create IBM PC compatible computers, creating an enormous boom in Silicon Valley. This personally benefited me directly, as I worked at Intel at that time.
My career path led me to be a systems and network administrator. Banatao’s creation of an ethernet controller chip enabled computer networking to really take off. Yet another way I and many others benefited from his work!
There are other contributions he made that affect almost everyone’s daily life. He pioneered graphics accelerator chips, a market that Nvidia would dominate and would use to power AI. One of his companies helped popularly consumer GPS.
Philanthropy
Dado Banatao never forgot his past growing up as a poor farmer’s son and going to school barefoot. He founded Phildev, an organization dedicated toward promoted STEM in the Philippines and with Filipino Americans. I actually volunteered as a mentor for Phildev scholarship students but had no idea that he was the founder of Phildev. He also was a founder of CITRIS, a University of California Research institute looking to use technology to improve people’s lives. After I had left Intel, I was looking at jobs and was really interested in CITRIS. Again, I had no idea of his role with this organization.
Obituary and Message from his Family
His family has posted a message on their website regarding his death. They also show pictures from his life and have a space for people to share memories. An obituary is on the way. The family also requests that people consider a donation to Phildev as a way to honor his memory.

 An Asian dad gets laid off after working decades in Tech, and his video about the experience has gone viral. Why did that happen? For me, his situation really connected. Like Asian Dad Energy (his channel name and what I will call him), I am an Ivy League educated engineer and father who took a package to leave a job in Big Tech after decades of work. With many other people being laid off from Tech, his experiences resonates widely.
 Number One Son and I would always stop by the
 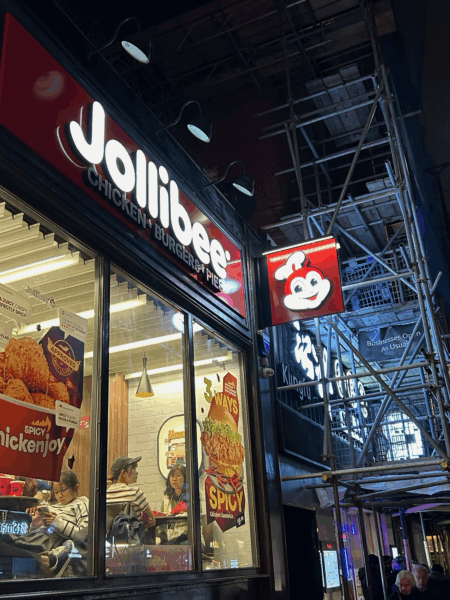 I usually get the Aloha burger, and then eat some of The Wife’s Chickenjoy. I don’t like their spaghetti, and I am not a big fan of palabok (a noodle dish) that much. Love to finish with the peach mango pie. My brother tends to look at Jollibee restaurants as a marker of Filipino presence. He sent me a picture of this one in Earl’s Court London, where a lot of Filipinos live.
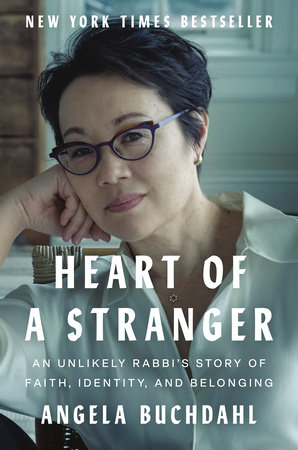 I read about the first Asian American Rabbi,
 I first heard of the film
 The
The 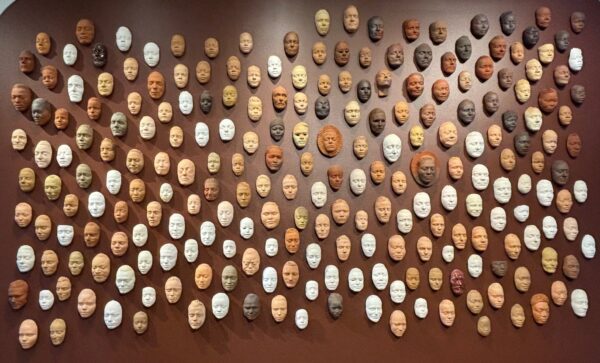
 Many news outlets across the country have reported how burglars target Asian Americans for robbery.


