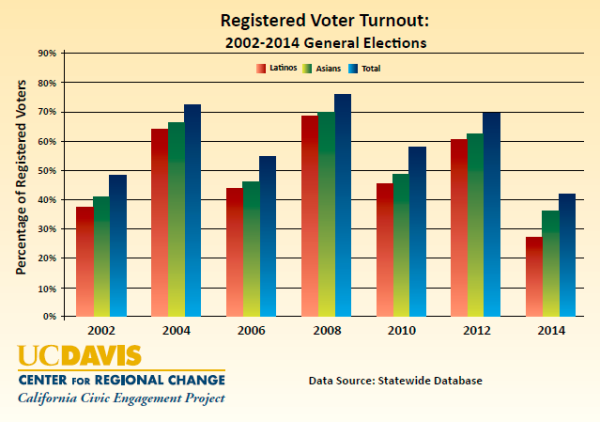
As I’ve blogged before, Asian Americans vote at a lower rate than almost any other demographic group, and this especially is the case in California – the state with the largest Asian American population (though Hawaii has the highest overall percentage). In non-presidential years and off-year elections, voter participation rates are extremely low. In 2014, there were no state-wide race or major ballot initiatives that I could think of, so this was not too surprising to learn:
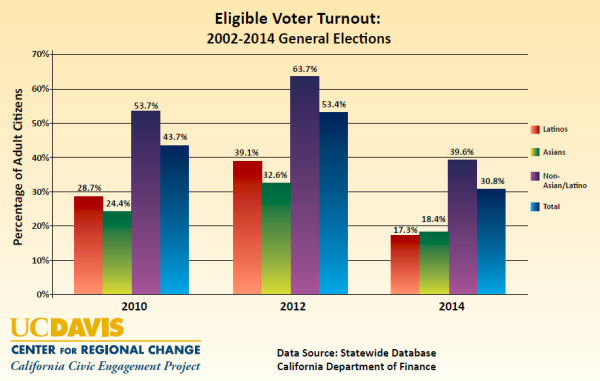
“A major reason for California’s record-low voter turnout last year was the extremely low rate of voting by the state’s two fastest-growing ethnic groups, a new analysis by the UC Davis Center for Regional Change reveals. … While just 41.7 percent of the state’s registered voters cast ballots last November, the rates of voting by Latinos (27.5 percent) and Asian Americans (36.3 percent) were markedly lower than those of whites and blacks, a combined 47.3 percent. … Asian Americans, with 13.3 percent of the state’s population, cast just 7.4 percent of the votes, the study found. … Overall, 30.8 percent of eligible Californians voted, but it was just 17.3 percent of eligible Latinos and 18.4 percent of Asian-Americans, contrasted with 39.6 percent of whites and blacks combined.”

So that is sad that only 18.4 percent of eligible Californian Asian Americans voted (to be eligible, you obviously need to be a citizen, 18 or older as well as registered to vote (which takes the tiny effort of filling out form)). Model Minority my ass! (LOL …)

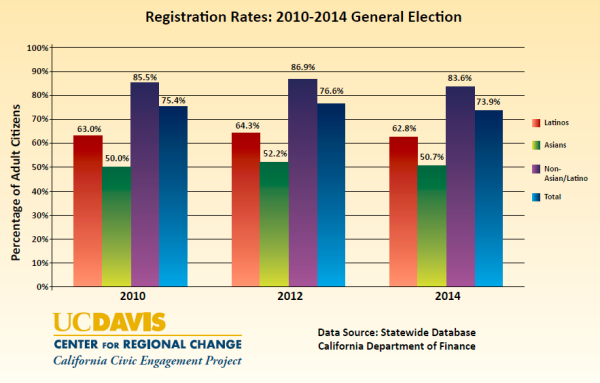
Californian Asian American voter registration rates compared to Californians overall as well as other demographic groups:

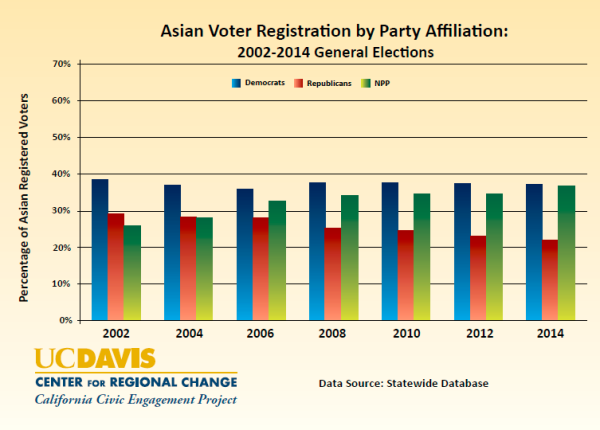
The party affiliation data didn’t surprise me too much:


